

English
Statistics in eZmax (eZmax for agents)
Statistics in eZmax
- From Main menu >> Statistics.
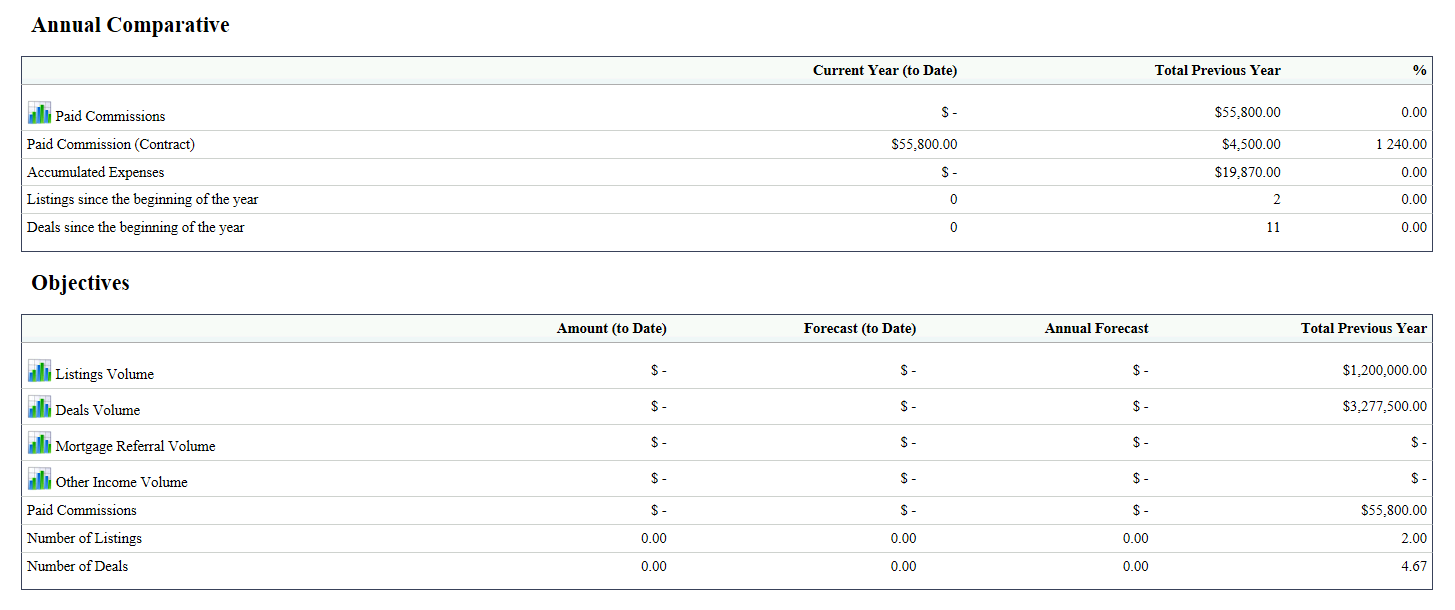
Annual Comparative
Paid Commissions : What you have earned in the Current Year (to Date) compared to Total Previous Year and the percentage (%) of where you at in that comparison.
Paid Commissions (Contracts) : Based on the numbers per your contract. For example, if you started March 1st, the amount in the Current Year (to Date) column represents the commissions earned from March 1st compared to last year, at the same date (Total Previous Year). You can also see the percentage (%) of where you at in that comparison.
Accumulated Expenses : Refers to your monthly billing, anything that your brokerage has paid for and rebilled you for, i.e. any expenses outside of your transactions.
Listings since the beginning of the year and Deals since the beginning of the year : Number of listings/deals since the beginning of the year (Current Year (to Date)) in comparison with the previous year.
Objectives
There is a module in the system to forecast, i.e. to give yourself objectives.
Listings Volume and Deals Volume : Even if you or your brokerage don’t use the forecast module, you will still get, in the statistics, the numbers to date of your listings and the numbers to date of your deals. For both, you can see the comparison with the previous year. If you use the forecast module, you will also see the comparison of where you at in that objective.
Paid Commissions : You will see how much you have been paid to date.
Number of Listings and Number of Deals : To date.
Graphs
- You can click on a graph icon to display a bar chart. See the example below when you click on the listings volume graph:
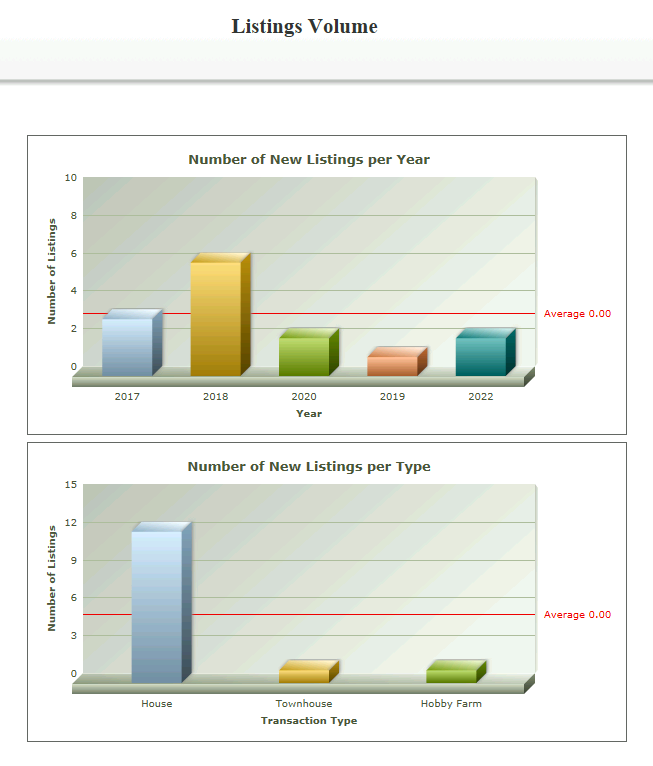
- You will see the number of new listings per year and the number of new listings per type (bungalow, house, townhouse).